

Effects of hydrocarbon gas composition on tight oil migration
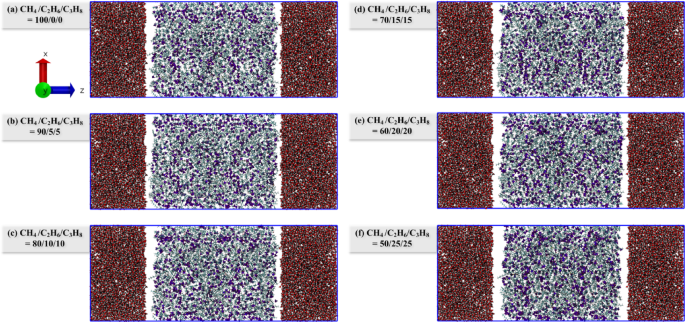
The miscibility of different hydrocarbon gas systems and tight oil under EMD simulation was observed, and the configuration of each system after EMD simulation was extracted (Fig. 3). It is observed that there is a distinct oil-gas boundary between the 100/0/0 and 90/5/5 systems (Fig. 3a, b), attributable to the high methane content in both systems. The constant pressure environment maintained in the EMD simulation is 20 MPa, whereas the miscibility pressure of methane and crude oil is also high (> 30 MPa)5, resulting in poor miscibility between the two systems. When the hydrocarbon gas ratio reaches 80/10/10, the mutual solubility of oil and gas significantly improves. As depicted in Fig. 3c–f, the gas is more uniformly distributed within the system. Consequently, during the EMD simulation phase, the presence of higher proportions of ethane and propane in the hydrocarbon gas enhances the miscibility of oil and gas.
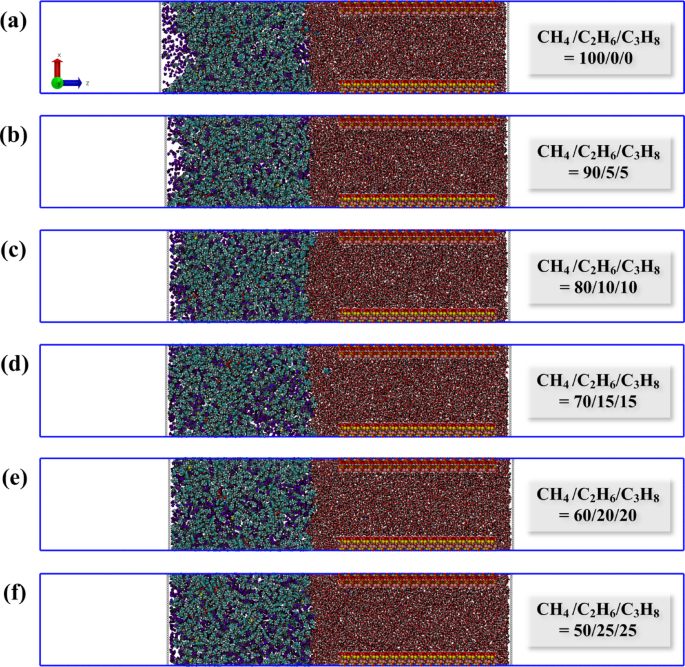
EMD simulation configuration of different hydrocarbon gas ratio systems: (a) CH4/C2H6/C3H8 = 100/0/0; (b) 90/5/5; (c) 80/10/10; (d) 70/15/15; (e) 60/20/20; (f) 50/25/25.
Subsequently, the results of the SMD simulations for all systems were compiled. To more accurately characterize the microscopic migration process, the spring force and the evolution of the number of carbon atoms entering the nano-pores were tracked as a function of simulation time. The force is a crucial factor that reflects the migration behavior of the system, while the number of carbon atoms entering the pore throat can, to some extent, indicate the migration rate; in other words, a greater increase in the number of carbon atoms corresponds to a faster migration rate. Given that the system is in a non-equilibrium state following the application of an external force, resulting in fluctuating forces, the spring force curve is subjected to smooth fitting (red line in Fig. 4). The force characteristics and dynamic configurations for each system are depicted in Figs. 4 and 5. By analyzing the variations in these two characteristic curves, the migration stages of each system can be distinguished.
As shown in Fig. 4, the migration process of each system is similar and can be divided into four stages. In stage I, the force for each system increases continuously, yet the number of carbon atoms entering the pore remains nearly zero. This is attributed to the self-compression of the oil-gas system upon being subjected to pressure, resulting in no actual migration. During stage II, a significant increase in force is observed, along with a slight increase in the number of carbon atoms. This is due to the oil-gas system forming a meniscus at the pore entrance, reaching a critical state for migration into the pores. Subsequently, the oil-gas system gradually passes through the pore which is labeled as stage III. Here, the force ascends to a peak and then stabilizes, exhibiting relative constancy in this stage. This indicates that the driving forces and resistance have reached an equilibrium, signifying the relaxation stage of the system. Finally, there is a decrease in force, and by examining the final configuration in Fig. 5, it is evident that this decrease is caused by the gradual expulsion of oil and gas from the pores.
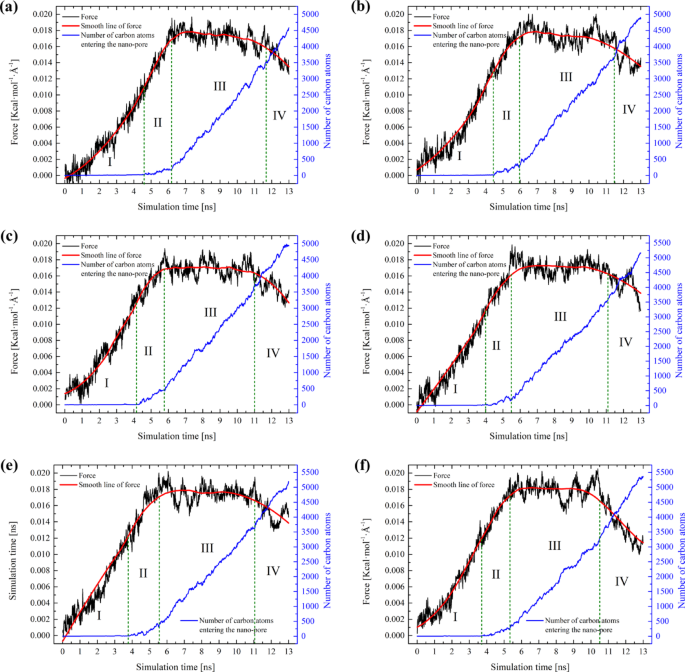
Force characteristics of different hydrocarbon gas ratio systems: (a) CH4/C2H6/C3H8 = 100/0/0; (b) 90/5/5; (c) 80/10/10; (d) 70/15/15; (e) 60/20/20; (f) 50/25/25.
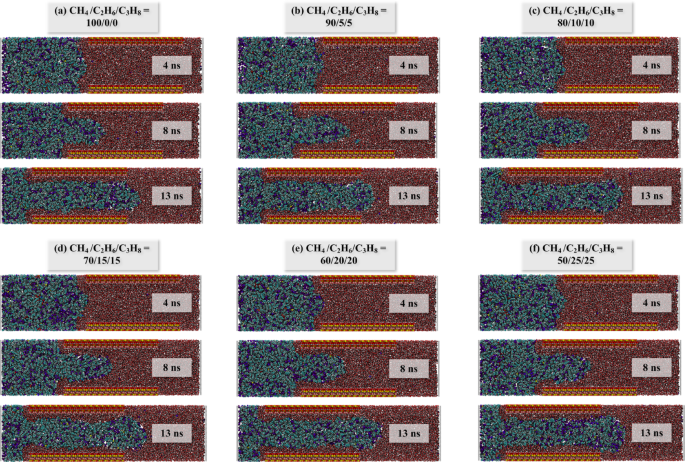
Dynamic configuration of each system: (a) CH4/C2H6/C3H8 = 100/0/0; (b) 90/5/5; (c) 80/10/10; (d) 70/15/15; (e) 60/20/20; (f) 50/25/25.
In analyzing the migration process of each system, two additional distinctions can be discerned from Fig. 4. Firstly, as the proportion of ethane and propane in the hydrocarbon gas increases, the time taken for the system to attain a stable migration stage tends to decrease. Although this trend is relatively subtle, it aligns with our earlier observations. Secondly, when the spring force of the system achieves a relatively stable condition (Stage III), the oil and gas migrate steadily through the pores. The spring force during this stable phase can be considered as the threshold resistance for the migration of oil and gas. Furthermore, the threshold migration resistance for the hydrocarbon gas ratios from 100/0/0 to 50/25/25 systems has been calculated, which are 0.01744, 0.01739, 0.01699, 0.01715, 0.01745, and 0.01787 Kcal·mol− 1·Å−1, respectively (Fig. 6a). To make the values more realistic, we converted the average spring force during the stable phase (Stage III) into pressure (MPa). The corresponding threshold pressure values for each system are 33.61, 33.51, 32.74, 33.05, 33.63, and 34.44 MPa, respectively. The pressure conversion method is listed in Supplementary Information.
It can be observed that the threshold migration resistance is following the order: F50/25/25 > F60/20/20 > F100/0/0 > F90/5/5 > F70/15/15 > F80/10/10. As the proportion of ethane and propane in the hydrocarbon gas composition increases, the threshold resistance of the system initially decreases and then increases. In addition, when contrasted with the previous simulation outcomes devoid of hydrocarbon gas (0.01896 Kcal·mol− 1·Å−1, 0/0/0 in Fig. 6a)41, various hydrocarbon gas systems demonstrate a capacity to lower the migration resistance of tight oil.
By overlaying the spring force smoothing curves from all systems (Fig. 6b), it is observable that the migration rate progressively increases, and the magnitude of force during the stable migration period corresponds with the order of the preceding statistical averages. Therefore, this reduction of migration resistance does not follow a linear trend, suggesting that the composition of hydrocarbon gas inherently influences the resistance characteristics of the system.
Figure 6 (a) The threshold migration resistance of the system varies with different hydrocarbon gas ratios, with the notation 0/0/0 indicating the absence of gas in the tight oil, and this value is taken from previous research work41. It can be observed that when hydrocarbon gas is absent, the resistance encountered during the migration of tight oil is significantly higher. After converting to pressure, this value reaches as high as 36.54 MPa, which is 2–4 MPa greater than that of systems containing gas. (b) The force summary of each system.
Based on the findings of our previous research, it is evident that the migration resistance of tight oil within nano-pores is predominantly affected by the oil-pore interactions and the Jamin effect46. Consequently, we will comprehensively analyze these two aspects to elucidate the mechanisms underlying the disparities among different systems.
The microscopic interactions
To understand the varying migration resistance across different systems, it is essential to offer reasonable insights into the microscopic fluid-solid interactions. The interaction energy between tight oil and hydrocarbon gas (Eoil−gas), the cohesive energy of oil-gas system (Ecohesive) and interaction energy between the oil-gas mixture and pore structure (Eoil/gas–pore) as a function of simulation time have been calculated (as shown in Fig. 6).
Examining the oil-gas interaction reveals that as the proportions of ethane and propane rise, the interaction between the oil and gas continues to strengthen (Fig. 6a). The stronger the Eoil−gas, the more enhanced the mutual solubility between oil and gas becomes. This also explains the phenomenon observed in the EMD simulations (Fig. 3), where better dispersion of gas within the oil system is noted when the proportion of ethane and propane exceeds 10%.
When a fluid flows, the cohesive forces between molecules resist their relative motion, generating internal friction, which hinders the fluid’s relative movement. The analysis of cohesive energy in oil-gas systems contributes to understanding the effects of cohesive forces. As shown in Fig. 6b, the evolution trend of Ecohesive is associated with the migration process of each system. During Stages I and II, the oil-gas experienced significant deformation when it was compressed from its initial position into the narrow pore, and the Ecohesive of each system increased. Once the Ecohesive of each system reaches its peak, this signals the maximum compression state of the oil-gas system (Fig. 5, approximately around the 4ns mark). The compression that occurs in Stages I and II exerts a certain resistance against migration. Subsequently, the Ecohesive of each system gradually declines and drops below the initial Ecohesive value. This implies that when the oil – gas migrates within the nano-pore, the cohesive force effect is diminished. Therefore, it can be inferred that Ecohesive is not the primary factor contributing to the resistance encountered during the oil-gas migration within the pore. Furthermore, we can observe that with the increase of ethane and propane components in the gas, there is no significant gradation in the cohesive energy of each system (Fig. 6b); all systems essentially remain at the same energy level. This also indicates that, under the current compositional adjustments, the cohesive energy of the oil-gas system may not be the primary factor influencing the differences in migration resistance.
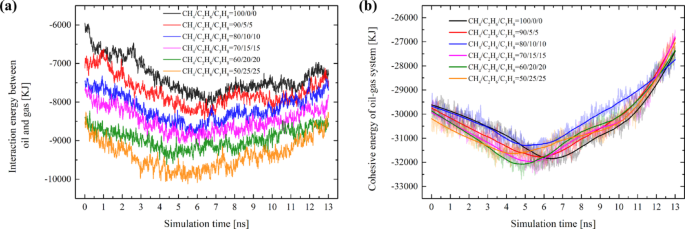
Variations in the interaction energy of different systems during migration: (a) The interaction energy between tight oil and hydrocarbon gas. (b) The cohesive energy of oil-gas system; A negative value of interaction energy signifies an increase in energy in the negative direction, indicating an enhancement of the interaction.
At the nanoscale, the intermolecular forces between fluids and solids are significantly enhanced, which is considered an important factor affecting the development of tight reservoirs. For interaction energy between the oil-gas mixture and pore: In all systems, the Eoil/gas–pore exhibited a trend of increment from zero as the simulation progressed. Due to significant fluctuations in the spring force before entering and after exiting the pore, the Eoil/gas–pore values for each system during stages I, II, and IV also varied considerably, resulting in poor stability. Moreover, since the threshold migration resistance of the system is solely associated with the stable migration period within the pore, our analysis focused exclusively on the Eoil/gas–pore values during the 6–11 ns interval (Stage III) for each system. Figure 7 illustrates that the energy ranking of different systems during the stable migration stage is positively correlated with the proportions of ethane and propane components (i.e. Eoil/gas−pore in different systems will be eventually in the following order: E50/25/25 > E60/20/20 > E70/15/15 > E80/10/10 > E90/5/5 > E100/0/0). Specifically, the higher the content of ethane and propane in the hydrocarbon gas, the greater the interaction energy between the oil-gas mixture and the pores. However, a higher Eoil/gas–pore indicates that the pore walls exhibit a relatively stronger adsorption effects on oil and gas. The pore walls on both sides generate a drag-like effect in the vertical direction, thereby increasing the migration resistance. Moreover, the effect of Eoil/gas−pore is also a reason why Ecohesive continuously decreases after reaching its peak. As the oil-gas system increasingly enters the pore, the attractive force from the pore wall becomes stronger, leading to a continuous weakening of the cohesive force within the oil-gas system.
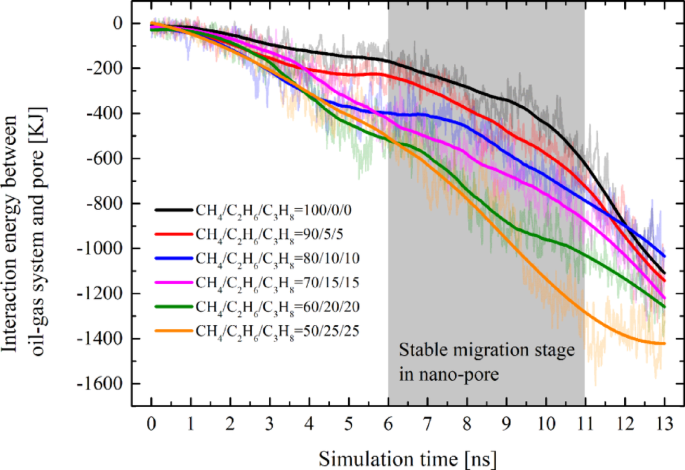
Variations of the interaction energy between oil-gas and the pore over the course of the simulation time. To eliminate the influence of fluctuations caused by non-equilibrium dynamics, only the stable data within the 6–11 ns interval was selected for comparison.
It is noteworthy that changes in the system’s energy indicate alterations in the system’s state. Based on the energy curves, we can identify which energy components are at play and analyze their approximate contributions to the migration resistance. However, quantifying the exact numerical value of the resistance they produce is currently not feasible and remains an issue to be addressed in our future work.
The jamin effect
In addition to microscopic interactions, the Jamin effect61,62 also significantly influences the migration process. As the oil and gas mixture moves from a wider area into a narrow pore, the reduction in droplet diameter generates additional pressure, impeding oil and gas migration (Fig. 8). Since the mineral surface in our simulation systems is coated with an adsorbed water film, the three-phase contact angle does not exist. Consequently, the Jamin effect can be described by the following equation:
$$\:\varDelta\:P=2{\upgamma\:}\left(\frac{1}{{R}_{1}}-\frac{1}{{R}_{2}}\right)$$
(3)
Where ΔP is the pressure of the oil and gas mixture entering the nano-pore, γ denotes the oil/gas-water interfacial tension, and R1 and R2 represent the radii of oil on the outer and inner sides of the nano-pore, respectively.
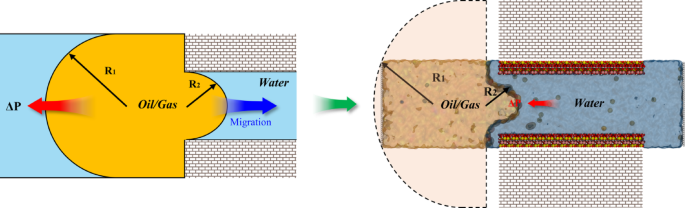
The schematic diagram of the Jamin effect and equivalent diagram in the simulation.
For the Jamin effect in different systems, the influencing factors include the oil/gas-water interfacial tension and the radii of the oil-gas on the inner sides of the pore. Considering that kaolinite is the sole pore matrix used in our simulation, its pore diameter and interactions with fluids remain consistent across all systems, which does not significantly impact the radius of the oil and gas mixture within the pores. Therefore, our analysis will primarily focus on the interfacial tension (IFT) between oil-gas and water.
It should be noted that when fluids are confined within nanoscale pores, their properties differ significantly from those of bulk fluids. For example, in our system, an ordered layer of adsorbed water forms on the kaolinite surface, exhibiting solid-like characteristics. This phenomenon affects the surface free energy between oil and water, leading to increased IFT44,53, making IFT measurement in non-equilibrium systems extremely challenging. However, since the solid surfaces and pore sizes in our simulation system are consistent, the adsorbed water characteristics are also largely consistent. We analyzed the adsorbed water features of the six systems during the stable migration stage, as shown in Fig. 9. It can be observed that the attributes of adsorbed water exhibit fundamental consistency across different systems. Therefore, as long as the water characteristics remain consistent, we applied the principle of equivalent substitution to replace the adsorbed water on the solid surface with bulk water. In this equilibrium system, the interface is approximately uniform, allowing for highly accurate IFT simulations. The evolution trends of IFT in the bulk phase are similar to those within the pores, although the IFT values may differ from those in the pore channels. Nevertheless, we can still perform qualitative analysis based on the bulk phase simulation results.
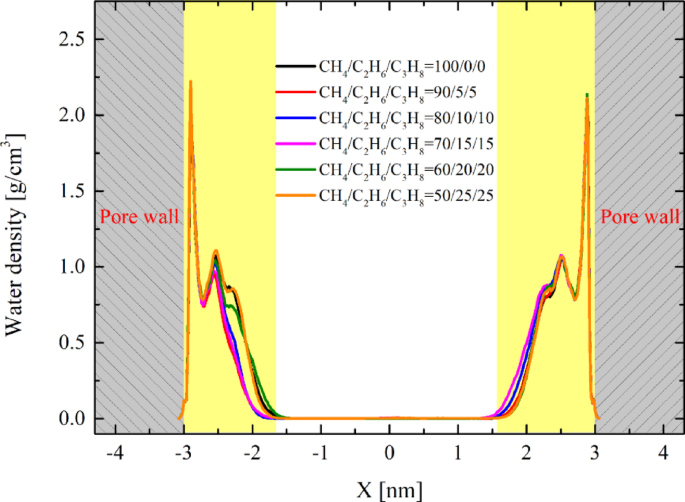
The density distribution of water in different systems.
Subsequently, the bulk-phase oil/gas-water interface calculation models with different hydrocarbon gas ratios were constructed (Fig. 10). Tight oil, hydrocarbon gas, and water molecules were placed in a rectangular simulation box. At 353 K and 20 MPa, a 6 ns MD simulation was performed under the NPT ensemble to relax the system, and then a 6 ns MD simulation was performed under the NVT ensemble to collect data. Due to the oil/gas-water interfaces being parallel to the X-Y plane and perpendicular to the Z axis, the interfacial tension can be calculated by the following equation63:
$$\:\varvec{\sigma\:}=-\frac{1}{2}\left(\frac{{P}_{X}+{P}_{Y}}{2}-{P}_{Z}\right){L}_{Z}$$
(4)
where PX, PY, and PZ are the diagonal elements of the pressure tensor, and LZ is the length of the simulation box in the Z axis. The simulation results of the last 1 ns are statistically averaged.
Calculation model of oil/gas-water interfacial tension with different hydrocarbon gas ratios.
The interfacial tension values for systems with hydrocarbon gas ratios ranging from 100/0/0 to 50/25/25 have been calculated as 33.62, 32.45, 31.34, 30.55, 30.21, and 29.61 mN·m− 1, respectively. Figure 11 illustrates that the interfacial tension of different systems exhibits a continuous downward trend. Specifically, the higher the proportion of ethane and propane in the hydrocarbon gas, the lower the oil/gas-water interfacial tension. This observation aligns with our previous findings, which demonstrated that adding pure ethane and propane to tight oil significantly reduces the interfacial tension34. A reduction in interfacial tension weakens the Jamin effect, thereby decreasing the resistance encountered during migration. Meanwhile, the decreased interfacial tension facilitates the molecules at the interface to more readily overcome the mutual attraction and transition into the other phase. This is one of the reasons why the duration needed for the oil and gas system to achieve stable migration (stage III) is comparatively brief with the escalation of ethane and propane constituents in the hydrocarbon gas.
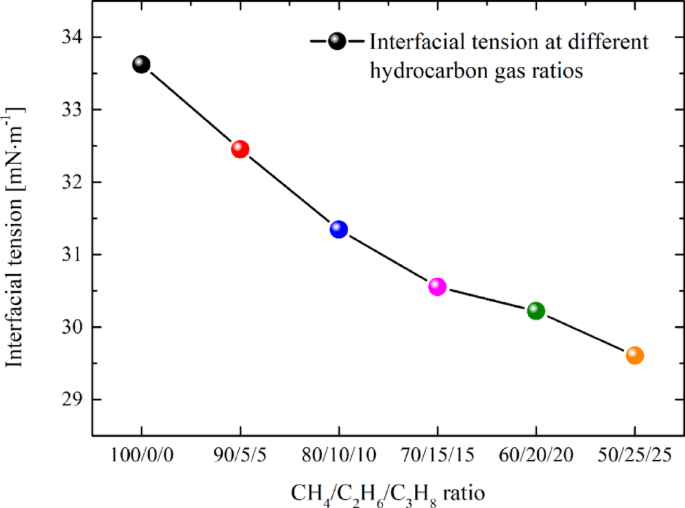
Oil/gas-water interfacial tension of different systems.
Finally, by integrating the findings on threshold migration resistance, microscopic interaction, and the Jamin effect, it becomes evident that the impact of Eoil/gas−pore and interfacial tension is unidirectional. An increase in Eoil/gas−pore impedes migration, whereas a decrease in interfacial tension facilitates it. Therefore, the threshold migration resistance initially decreases and then increases primarily due to the hindrance caused by the rise in Eoil/gas−pore outweighing the reduction in resistance from the weakening of interfacial tension.
In summary, introducing hydrocarbon gases is beneficial for reducing migration resistance and interfacial tension, thereby enhancing tight oil migration. Nevertheless, it is crucial to maintain an optimal composition of the hydrocarbon gases used. Specifically, the proportions of ethane and propane should be carefully balanced; an excessively high concentration of heavier hydrocarbons can augment the interaction with the pore system, escalating the migration resistance, while an overly low concentration can increase the oil/gas-water interfacial tension, impeding the flow and boosting the resistance. The most favorable methane/ethane/propane ratio lies between 80/10/10 and 70/15/15, at which point the migration resistance is minimized, and the oil/gas-water interfacial tension is substantially reduced.